Image: Rystad Energy
Australia’s utility-scale solar PV and wind assets collectively generated 4.7 terawatt-hours (TWh) in April 2026, marking a 24% year-on-year (YoY) increase from 3.8TWh in April 2025, according to Rystad Energy data.
The robust growth follows a modest 2% YoY rise in March, driven by improved wind conditions in the National Electricity Market (NEM) and ongoing capacity additions.
Geographic Concentration & Top-Performing Assets
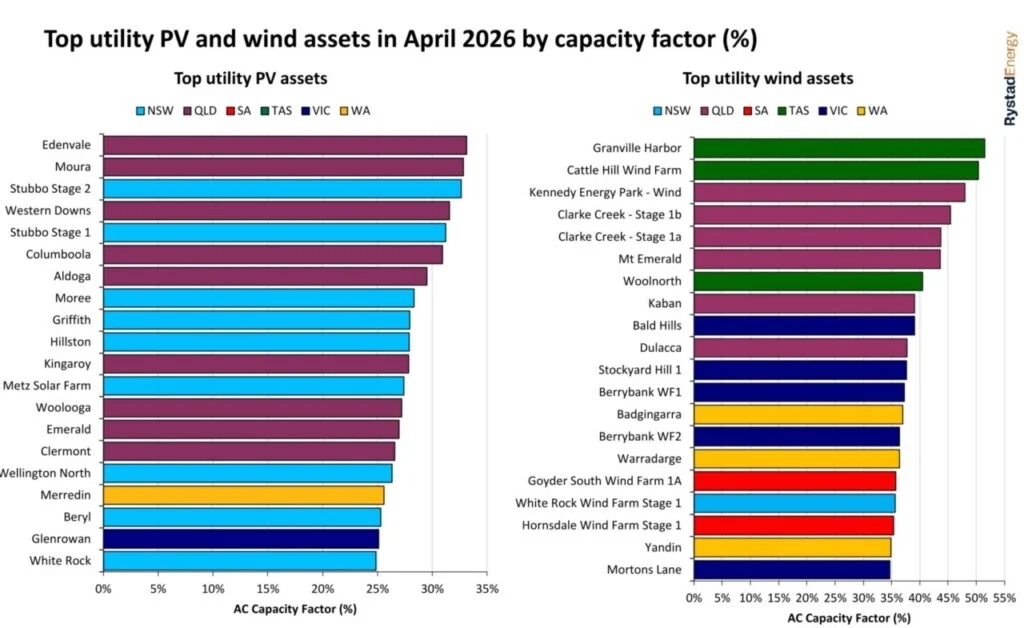
April’s generation data highlights persistent geographic concentration. Queensland and New South Wales (NSW) dominated utility solar rankings, while Queensland and Tasmania led wind generation.
- Utility Solar: The top five assets by AC capacity factor were exclusively in Queensland and NSW. ENEOS Group and Sojitz Corporation’s 204MW Edenvale Solar Park topped the list at 33.1%, followed by METKA’s 110MW Moura Solar Farm (32.8%) and ACEN Australia’s 400MW Stubbo Stage 2 (32.6%).
- Wind Generation: NEM wind output reached 2.76TWh in April, up 33% YoY, with all NEM states recording growth. Top wind assets were in Queensland and Tasmania: Atmos Renewables and Palisade Investment Partners’ Granville Harbour Wind Farm (51.5%), Atmos Renewables’ Cattle Hill (50.4%), and Eurus Energy Holdings’ Kennedy Energy wind farm (48%).
Queensland emerged as the standout state, delivering 1,256 gigawatt-hours (GWh) of combined utility solar (678GWh) and wind (578GWh) generation. The state’s wind generation surged 112% YoY.
Gas Generation Plummets; Battery Storage Milestones
April marked a significant shift in Australia’s energy mix:
- Gas Generation: NEM gas generation fell to 382GWh, a 49% YoY drop and the lowest monthly level in over two decades, as battery storage displaced gas during evening peaks.
- Battery Storage: Queensland became the first NEM state to discharge over 100GWh in a single month. Two projects began construction: Alinta Energy’s 250MW/1GWh Reeves Plains battery (South Australia’s largest) and Hanwha Energy’s 100MW/200MWh Tangkam battery (NSW).
- Intraday Spreads: Expanding battery capacity collapsed NEM intraday spreads, averaging under AU$110 (US$78.85) per MWh across most states.
Renewable Curtailment Challenges
Approximately 571GWh of renewable energy was curtailed across the NEM in April (316GWh wind, 255GWh solar), with 459GWh curtailed during negative-price intervals. Victoria led curtailment(255GWh), followed by NSW (122GWh), South Australia (100GWh), and Queensland (95GWh).
Tasmania’s curtailment was negligible. The figures underscore grid infrastructure gaps, with 2025 curtailment exceeding 7TWh, highlighting the need for more transmission and storage.